
My current subject is the seasonality in the number of births. I have looked up the number of live births in several countries over a number of years with monthly resolution. My primary question is whether there are certain months of the year in which more babies are born than could be expected.
There are a few other related, truly intriguing questions, but we will not be able to say much about them based on the available data beyond mere speculation. The most directly accessible one is the seasonality in conception rate: to what extent is it defined by seasons (time spent indoors and the like), and how much influence does culture have on it? What would also be very interesting to find out is the seasonality in the number of sexual intercourses. Well, I can’t say much about the latter one, but I will explain why.
The easy part is to say that most babies are conceived about nine months before birth (that is, three months later than birth, minus one year). Where I give up is disentangling two interacting factors: first, what proportion of pregnancies is unplanned, second, what the fate of pregnancies is: live birth, induced abortion, miscarriage, stillbirth. Relative to the number of live births, there are rather few stillbirths. However, the number of miscarriages and especially abortions is quite high, they occur in a wider time window after conception than birth, and certainly abortions are induced much more frequently in unplanned pregnancies.
What this means is that it would require some more serious work to add back prematurely terminated pregnancies to the number of live births if one was interested in the number of conceptions per month. Further, contraception and the bias in the number of induced abortions towards unplanned pregnancies means that the seasonality in live births in itself (the data I work with) is not directly informative about the seasonality of intercourses (which, I am sure, would interest many). There might be a completely different time distribution for intentionally unprotected intercourses from that of all other intercourses, but when measured indirectly by live births, the latter are masked by effective contraception and additionally by induced abortions.
In the case of planned pregnancies, the conscious decision to end contraception is not the whole story, psychological effects (low stress level) and physiological circumstances are also very important for successful conception, all the way to fertility treatment. Consequently, even if we knew the time distribution of planned conceptions, it would not tell us everything about the seasonality of couples’ decision to have a baby. This about summarises what we are not going to find out.
What I do is that I compute one single indicator of birth numbers. Take a month, like May 2009, and take a country. First, from the live birth count for this specific month and country, I compute how many babies were born on an average day in this month in the country, taking into account the different lengths of months and also leap years. Second, from the annual total live birth count (for 2009), I compute how many babies were born on an average day in the entire year in the same country. If we divide these two numbers, we get something close to one: if it is greater than one, it shows that more children were born in this May than would be expected from the length of the month. If we repeat the calculation over many years, we will find that some months are consistently `more popular’ while others are `less popular’.
England and Wales
Let’s see the first example. I plot 12 lines, one for each month over the years for which I found data. We see that September, July, June and August tend to be at the top, while December and January at the bottom.

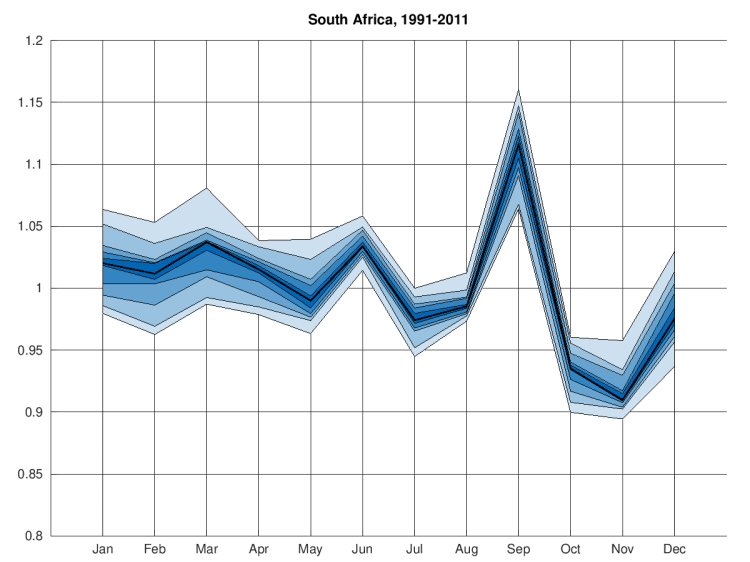
To visualise this trend better, I use a fan chart, although in an unusal way. Fan charts are most frequently used to display uncertainty in the prediction of future time series, e.g. in the prediction of the rate of inflation. Here I have got a set of values for each month (in this case 21 datapoints), and I display their spread above the corresponding month. For a given month, there is one datapoint in the white area below the shaded area and one datapoint above, and there are two datapoints within each shaded band (with the possible exception of the middle one or two bands, which has to do with the parity of the number of datapoints). The lines separating the different shades are at the average of the two neighbouring datapoints, which are the upper datapoint of the band below and the bottom datapoint of the band above. The central black line is the median.

The previous observations are corroborated: the median is above 1 for months from May to September, and is around 0.975 for December and January.
Canada
Similarly to England and Wales, Canada has September, June, July, August near the top. The months from November until February are the least popular. While in the 1990s April, May and June were the leaders, for the last decade April and May dropped to the midfield. July, August and September became from simply overrepresented months the top. February and March dropped from midfield to lower half, October rose from lower midfield to midfield, and November rose from bottom to lower midfield. December and January linger at the bottom consistently.

To capture these trends, I plot the first and the last 10 years in two separate fan charts. We see that seasonality is more pronounced than it is in England and Wales. In fact, England and Wales have unusually low seasonality and Canada is more typical among the countries we encounter.


Interestingly, there seem to be two smaller peaks at December 1999 and January 2000!
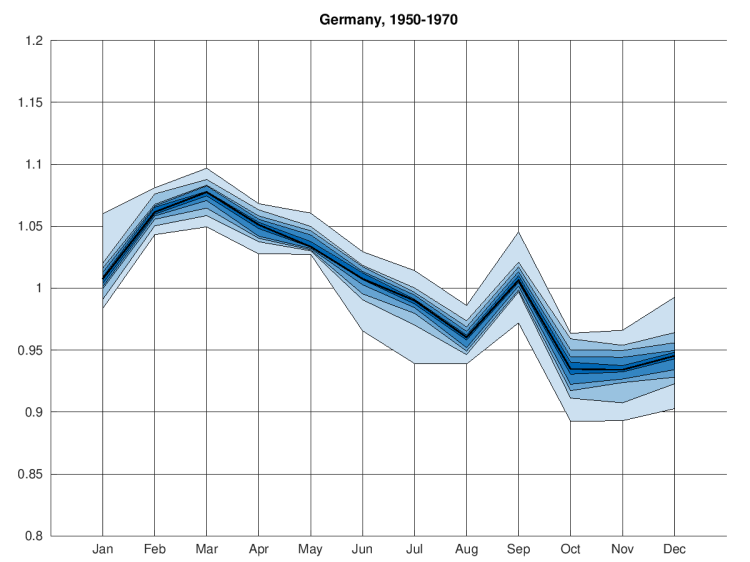
Germany
For Germany, I found data going back to 1950. September, July and August are clearly rising to the top, while February, March, April and May are falling to the bottom.

The first 21 years are relatively stable, and so are the last 21 years. Most of the rearrangement happened in the 1970s and some more in the 1980s.


These observations are reflected in the fan charts, as is considerable seasonality.

Hungary
In the case of Hungary, I could access data for the last four years and I had data for 2002-2005 that had been saved years ago when I first started thinking about these questions. September, July and August are in the lead. March, April, May, November and December are perennially less popular.

There is a strange rearrangement in 2010. It is actually not the case that February and March would have brought many births. Instead there was a ten percent drop in birth numbers from previous years’ averages for May to October 2010. I wonder if this was the effect of the uncertainty surrounding the global financial crisis. There is no question that the crisis reached Hungary with a considerable delay after it had started in the financial centres of the USA and the UK, but for the panic to set in, August 2009 and onwards might be a bit too late. Spring and summer 2009 was the time when the world was gripped by the spread of the H1N1 swine flu pandemic (with pregnant women considered at a higher risk of complications). It would be interesting to verify what the press and the media were talking about in Hungary back then.

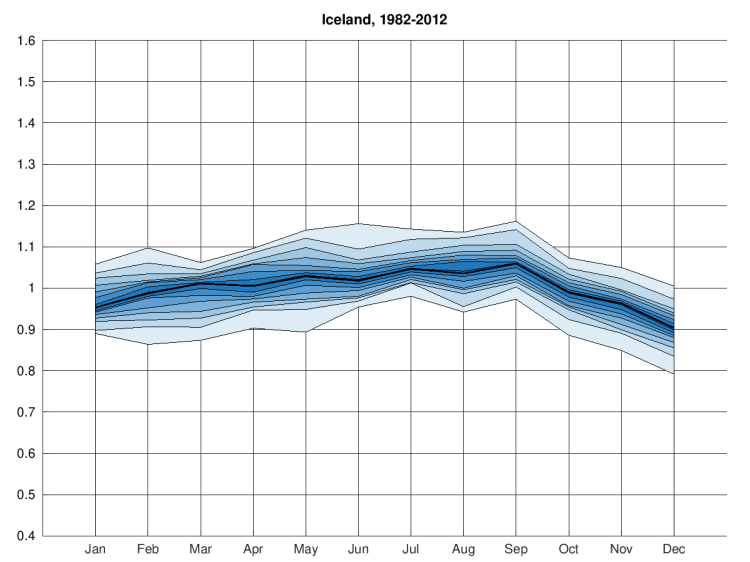
Iceland
Iceland is a really interesting case because there is data available going back to the mid-19th century. You’ve got to love Iceland! The first thing to notice is the enormous decrease in seasonality of live birth counts over the past 160 years.

Notice also how I had to change the vertical scale to increase the range from 0.8-to-1.2 to 0.3-to-1.7. The first 31 and the last 31 years were plotted on identical scale. I realise this makes the squashed graph of recent trends harder to compare to other countries, but this way the difference between the past and the present is striking.


In the 19th century life almost followed a regular pattern: most kids were conceived from September to January. When the snow finally melted and the front doors were no longer blocked, people could come out of their homes, the sheep were herded out, work started on the fields and the fishermen left for the sea. Maybe that’s not how it went (what is the season for fishing?), but clearly, there were few babies conceived from March until July. I believe the high variability (I mean the width of the shaded area around the median, not the large swings of the median over the year) is just a consequence of the small population of Iceland.
The recent years show peaks in September and July, followed by August. December has by far the fewest births, followed by January and November.

Across the countries seen so far, September and July everywhere bring high birth numbers, August never dropping far behind. What about countries on the Southern Hemisphere? Do they have their peaks shifted by exactly six months or not?
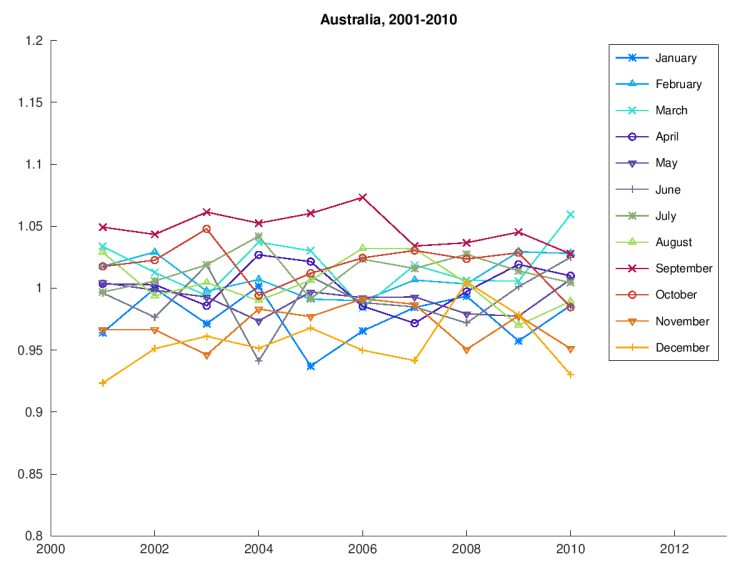
Australia
Australia shows a varied picture. Strikingly, September is once again the month to be born in. November, December and January have the fewest births. This is very similar to England and Wales, Canada and Iceland, and to an extent Germany and Hungary as well. However, Australia is also a country with low seasonality so one perhaps shouldn’t read much into this.

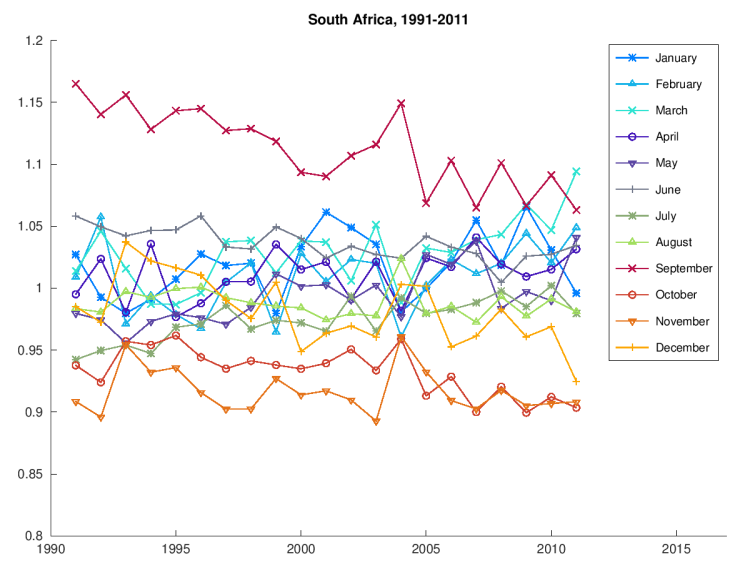
South Africa
Our last country is also of the Southern Hemisphere. South Africa exhibits a large peak in September. The months with the fewest births are October and November, which is something new. The seasonality is really high in South Africa in comparison to the other countries.
Conclusion
I studied live birth numbers of seven predominantly Christian countries, five from the Northern Hemisphere, two from the Southern Hemisphere. In each of them, the month with the highest average number of daily births is September. This corresponds to conception in December. I speculate that this is a result of the Christmas holiday period, when people have more free time and are less stressed.
There is a second peak in most countries of the Northern Hemisphere in July. Actually, there is a V shape for most in the July–August–September interval. Babies born in July are conceived in October, and this increase might result from the earlier dusk (the end of the daylight saving time comes at the end of October in Europe, at the beginning of November in North America), the longer nights and the cooling weather, all of which force people indoors. Alternatively, this might be the time when many people are confirmed in (and finish settling into) a new job, which might be a deciding factor for many couples to start trying to conceive.
Low birth rates in December and January reflect low conception rates in March and April. This is when the spring arrives and the just discussed trend of the weather reverses.
The present England and Wales, Canada and Iceland show rather similar fan charts, and Germany and Hungary are also alike. One could argue that this grouping also reflects similarities in the cultures of these countries, but why should that be exhibited in the seasonality of birth rates? Might the lower birth rate from March to May in Germany and in Hungary be a reflection of a negative impact on sexual activity of tiring or time-consuming outdoor activities (whether work or leisure) in the summer or of the often very hot summer weather? With a half year (or rather seven months) offset, we see a similar drop in birth rates in South Africa for October to December. The exclusion of September (the seven months shift instead of six months) might just be the `Christmas effect’.
Obviously, there is a long list of countries one could still look at. For some which I wanted to study, I couldn’t find monthly birth data (USA, Austria, China, Japan, Singapore, New Zealand). There are many countries whose cultures are very different to the ones studied, at the same time I have very little knowledge about them to be able to interpret what I might find. For example, it would be interesting to see how the Ramadan affects conception rates in Muslim countries.
Plotting figures only, the way I have done, is methodologically rather unsophisticated. If somebody knows how to do it, they could try to reject the nullhypothesis of no seasonality (and compute a p-value), that is, that the births are distributed multinomially among the months, with outcome probabilities decided purely by the lengths of the months. There are plenty more questions to follow up.
References
- Australian Bureau of Statistics, 3301.0 – Births, Australia, 2011. TABLE 6: Births, Year and month of occurrence, States and territories—2001 to 2011, Table 6.9.
- Statistics Canada, CANSIM Table 102-4502
- Office for National Statistics
Birth statistics, England and Wales (Series FM1), No. 27, 1998
Birth statistics, England and Wales (Series FM1), No. 32, 2003
Birth statistics, England and Wales (Series FM1), No. 37, 2008 - Statistisches Bundesamt, GENESIS-Online Datenbank, Table 12612-0002, Lebendgeborene: Deutschland, Monate, Geschlecht
- Hungarian Central Statistical Office, STADAT Tables; 1.1. Vital events/Live birth, Death, Marriage, Divorce, Foetal losses; Infra-annual data
- Statistics Iceland, Births by months 1853-2012
- Statistics South Africa, Statistical release P0305 — Recorded live births, 2011; Appendix G
Data analysis and plotting were conducted with the free software package GNU Octave and I am grateful for the opportunity to the Octave development community. The implementation of the fan chart was inspired by Marco Buchmann’s Matlab code.

The ‘Christmas effect’ is quite strong. I really wish to see your future study about some non-Christian dominant countries.
It would certainly be interesting, but I find digging up the data boring!
That’s true. I tried to check the population data in China, and found it seems impossible to obtain public available birthday distribution data.
This is fascinating.. I wish I was better at maths so i could understand the graphs better… I’m just going to read it again now!
Thank you!
Very nice study. It would be interested to see the data for the USA. If the Christmas-hypothesis is true I would expect a less pronounced peak in September, since only the 25th of December is a federal holiday and the 26th only in a few states. So the influence of Christmas should be comparable to the influence of Thanksgiving (last week in November).
Interesting idea! I couldn’t find the data at the time. (This would be a place to look: http://www.cdc.gov/nchs/fastats/births.htm)
If anybody tracks down data for another country they want to see, I have the pipeline to plot the two figures. I can be talked into doing it if formatting the input isn’t too much work!
Beside Thanksgiving and Christmas, there is also the New Year with associated celebrations and holidays. However, this is only a week after Christmas and should be indistinguishable from Christmas in the time resolution of the data and the varied length of pregnancies. Thanksgiving being only 1 month earlier than Christmas might also result result in their hypothetical effects forming a single effect in the birth rates.
What about when the school year starts? I know in the UK (and most north hemisphere countries?) it’s August/September. Many, many parents try to give their child the best advantage of being amongst the oldest in their year as it is perceived to give them an advantage (particularly early on when a the year between oldest and youngest in a class is a significant proportion of the child’s life).
The Christmas effect is a nice idea though, as always there are too many confounding factors to be absolutely sure – but for my money this socio-educational reason is prodominent.
(the effect of festivals is not to be underestimated, however…in my group of friends there is an (non-statistically significant) noticeable concentration of birthdays in November; 9 months after St Valentines day.)
That might well be a consideration, but the cutoff date is also important. In Hungary, it seems, it’s the 31st May, meaning that if a child is 6 years old by 31st May (and developed enough), then they go to school in September. So then parents should be aiming for June to get this advantage! (But parents may not know that there is this cutoff date so many years before it matters – so you might be onto something.)
The academic year (acc. to Wikipedia) starts in Jan in SA, in Jan/Febr in Australia and New Zealand, in Febr in Brazil, in Febr/March in Chile.
You wrote that the seasonality is sometimes more and sometimes less pronounced, and it is often obvious from the graphs. I wonder if it would make sense to quantify this, maybe in the form of an RMSD, to better follow how this changes over time, especially for the countries where you have data for a longer time period.